13-Week Cash Flow Forecast
See the week you run short before you get there, not after.
About the 13-week cash flow forecast
Profit and cash are different problems. A business can be trading well on paper and still miss payroll, because the invoices went out in March and the money arrives in May. A cash flow forecast is the tool that separates the two, and thirteen weeks is the horizon that has become standard for it: one full quarter, far enough ahead to do something about a shortfall, near enough that most of the receipts and payments in it are already known rather than guessed.
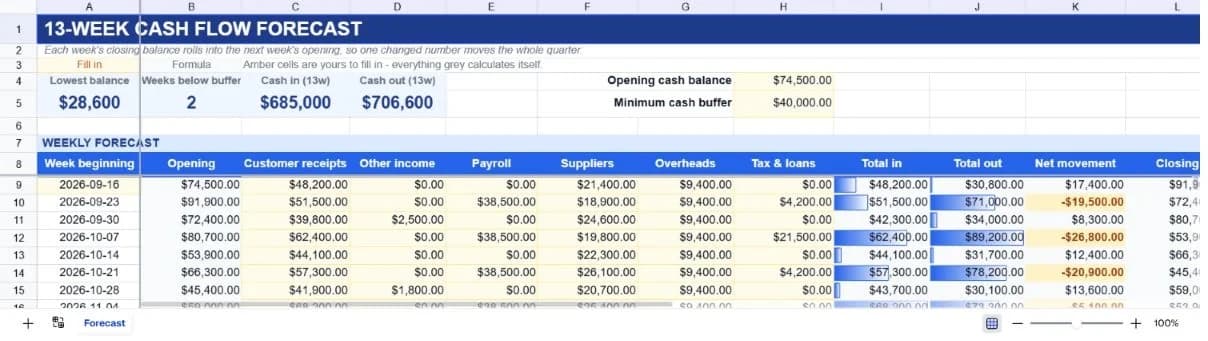
This template lays those thirteen weeks out as rows. Each one takes what you expect to collect and what you expect to pay, split into the four categories that actually behave differently: payroll, suppliers, overheads, and tax or loan repayments. Everything else is derived. Total in, total out and net movement calculate per week, and the closing balance flows straight into the next week's opening, so changing a single receipt in week three re-forecasts the ten weeks after it.
Two settings sit above the grid and drive the whole sheet. The opening cash balance seeds week one. The minimum cash buffer is the line you do not want to go under: any week that closes below it turns amber, and any week that closes below zero turns red. The summary strip reports your lowest projected balance and how many weeks breach the buffer, which between them are the only two numbers most people need from a forecast.
What’s in the template
Everything below is already built into the file. Open it and it’s there.
Thirteen weekly rows with rolling balances
Each week opens with the previous week's closing balance, so the whole quarter re-forecasts from any single change. Only week one's date is typed; the rest step forward seven days automatically.
Split outflow categories
Payroll, suppliers, overheads and tax or loan repayments are separate columns, because they have different timing and different consequences if you delay them.
Buffer breach highlighting
Weeks closing below your minimum buffer turn amber; weeks closing below zero turn red. Both thresholds come from a cell you set, not a rule baked into the file.
Summary strip
Lowest projected balance, count of weeks below buffer, and total cash in and out across the quarter, all calculated from the grid below.
In and out data bars
The total-in and total-out columns carry in-cell bars, so the heavy weeks stand out while scrolling without anyone having to build a chart.
Quarter totals row
Every category totals across the thirteen weeks, with the closing balance carrying the final week's figure rather than a meaningless sum.
Who it’s for
Small business owners
You know roughly what is coming in and going out, but not what the balance looks like in week nine. This puts that number on screen without an accountant or an accounting package.
Finance teams reporting to a board
Thirteen weeks is the format investors and lenders expect to see. The layout here matches the convention closely enough to paste into a board pack without reformatting it first.
Anyone with seasonal or lumpy income
Agencies, contractors and seasonal businesses have months where nothing lands. Weekly granularity catches the gap that a monthly forecast averages away.
Businesses managing a tight runway
If the question is how long the money lasts, the lowest projected balance in the summary strip answers it directly, and the buffer setting tells you when to start worrying.
How to use the 13-week cash flow forecast
- 1
Set the opening balance and buffer first
Put today's actual bank balance in the opening cash cell and your comfort threshold in the buffer cell. Nothing else on the sheet means anything until those two are right.
- 2
Fill the receipts you already know about
Work along the customer receipts column using your invoice due dates rather than your invoice dates. Forecasting when clients pay, not when you billed, is the difference between a useful forecast and an optimistic one.
- 3
Add the payments that are already committed
Payroll, rent, loan repayments and any supplier invoice already received. These are the ones you cannot move, so they anchor the outflow side.
- 4
Read the closing balance column
Scan down for amber and red. If a week breaches, work backwards from it: what can you collect earlier, or pay later, to lift that specific week?
- 5
Roll it forward every week
At the end of each week, replace the forecast figures with actuals, update the opening balance, and add a new week at the bottom. A forecast you refresh is worth more than one you build perfectly once.
The formulas that ship with it
Every one of these is already in the file. They’re listed so you can see how it works, and change it if you want to.
Opening balance (column B, week two onward)
=L9Each week opens with the previous week's closing balance. This single reference is what makes the forecast roll rather than sit as thirteen unconnected weeks.
Closing balance (column L)
=B9+K9Opening balance plus net movement. Everything else on the sheet exists to make this one number trustworthy.
Weeks below buffer (summary strip)
=COUNTIF(L9:L21,"<"&$H$5)Counts closing balances under your threshold. The criterion is built from the buffer cell rather than a hard-coded number, so raising the buffer re-counts immediately.
Total outflow (column J)
=SUM(E9:H9)Payroll, suppliers, overheads and tax across one week. Keeping the categories separate but summing them here means you can see the composition and the total at once.
Tips for getting more out of it
- Forecast receipts by when clients actually pay, not by payment terms. If your average is Net 30 plus twelve days, use forty-two days. Optimism here is the single most common reason a forecast misses.
- Set the buffer higher than you think you need. A buffer that only alarms once you are already in trouble gives you no time to act, which defeats the point of forecasting at all.
- Keep VAT or sales tax in the tax column rather than netting it off receipts. It is money passing through your account that was never yours, and treating it as income is how businesses get caught short at a filing deadline.
- Once your figures are in, ask the assistant which week is tightest and what would need to change to clear the buffer. It reads the grid the same way you do, faster.
Ask questions about your data, generate formulas in plain English, and create charts instantly, all on top of the 13-Week Cash Flow Forecast.
Questions about this template
More finance templates
Personal Budget Tracker
Plan and actual side by side across twelve categories, with your savings rate worked out for you.
Use thisSales Performance Dashboard
Quarterly bookings against annual quota, with attainment and gap-to-target per rep.
Use thisBusiness Expense Report
Receipts, mileage and approvals on one form, with separate billable and reimbursable totals.
Use thisSave hours
Skip the setup. Start from a ready-made structure.
Error-free
Pre-tested formulas that just work.
Professional
Designed for real-world use, ready to share.
Consistent
Maintain standards across every document.
Ready to use the 13-Week Cash Flow Forecast?
No setup, no learning curve, just results. Start free in seconds.
Pay as you go, no subscription required