Sales Performance Dashboard
Quota attainment per rep and per quarter, without rebuilding the maths every review.
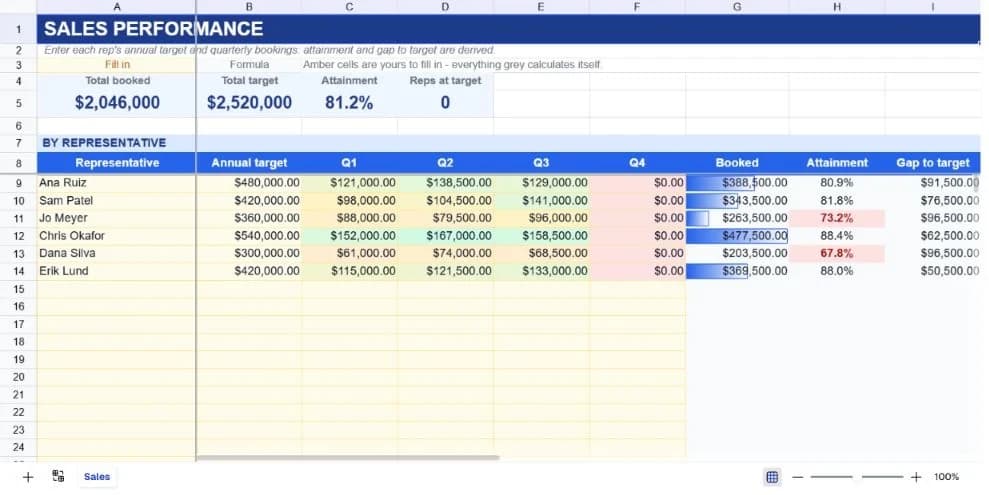
About the sales performance dashboard
Sales reporting usually breaks down into two questions that get asked every single week: who is going to hit their number, and how is the quarter tracking against the last one. This template answers both from one table, so the weekly forecast call stops being an exercise in mental arithmetic.
Each representative gets a row with an annual target and four quarterly booking figures. From those six inputs the sheet derives total booked, attainment as a percentage of quota, and the remaining gap to target. A summary strip across the top rolls the whole team into total booked, total target, blended attainment, and a count of how many reps are at or above quota.
Underneath the rep table sits a quarterly roll-up showing bookings by quarter, each quarter's share of the year, and growth against the prior quarter. Q1 deliberately leaves the growth cell blank rather than showing a meaningless zero, since there's no prior quarter on the sheet to compare it to.
What’s in the template
Everything below is already built into the file. Open it and it’s there.
Team summary strip
Total booked, total target, blended attainment and the number of reps at or above quota, all derived from the table below.
Per-rep table with twenty rows
Six sample reps plus spare rows, each with annual target, four quarterly figures, total booked, attainment and gap to target.
Attainment percentage
Bookings divided by target, so a rep at 104% and a rep at 81% are immediately distinguishable regardless of the size of their quotas.
Gap to target
Target minus booked. Positive means still to sell; a rep past quota shows a negative gap, which reads correctly as overshoot.
Quarterly roll-up
Bookings by quarter with each quarter's share of the year and growth versus the preceding quarter.
Frozen header and first column
Rep names and column headers stay put as you scroll a long team list sideways or down.
Who it’s for
Sales managers running a weekly forecast
Attainment and gap-to-target are the two columns most forecast conversations revolve around, and both update the moment a booking figure changes.
Founders without a CRM yet
If the team is small enough that a CRM is overkill, this covers the reporting a CRM would give you without the seat cost or the setup.
RevOps preparing a board pack
The quarterly roll-up with share-of-year and quarter-over-quarter growth is the table that usually gets rebuilt by hand for every board deck.
Individual reps tracking their own number
Delete the other rows and it becomes a personal quota tracker with the same attainment maths.
How to use the sales performance dashboard
- 1
Enter annual targets first
Set each rep's quota in column B before anything else: every percentage on the sheet depends on it, so the attainment column stays blank until it's filled.
- 2
Update quarterly bookings
Type closed-won figures into the four quarter columns. Leave future quarters at zero; the totals and attainment adjust as the year fills in.
- 3
Sort by attainment for reviews
Sorting on the attainment column puts the reps who need coaching at one end and the ones worth learning from at the other.
- 4
Read the quarterly roll-up for trend
The rep table answers who; the quarterly block answers whether the business is accelerating. Both matter, and they're rarely the same story.
The formulas that ship with it
Every one of these is already in the file. They’re listed so you can see how it works, and change it if you want to.
Booked (column G)
=IF(A9="","",SUM(C9:F9))Sums the four quarters. Blank rep rows stay blank instead of reporting a $0.00 booking.
Attainment (column H)
=IF(OR(A9="",B9=0),"",G9/B9)Bookings over quota. Guards against both an empty row and a rep with no target set, either of which would otherwise error.
Reps at target (summary)
=COUNTIF(H9:H28,">=1")Counts attainment values of 100% or more. Blank cells aren't counted, so spare rows don't inflate the figure.
Quarter-over-quarter growth
=IF(B33=0,"",B34/B33-1)Growth against the preceding quarter, blank for Q1 since there's nothing before it on the sheet.
Tips for getting more out of it
- Enter bookings as closed-won only. Mixing pipeline into the same columns makes attainment meaningless and it's the most common way this kind of sheet stops being trusted.
- If quotas change mid-year, keep the original in a spare column before overwriting. Attainment against a moved target tells you very little.
- A blended team attainment above 100% with half the reps below it usually means one or two large deals are carrying the number. The per-rep column is where you see that.
- Ask the assistant to chart bookings by quarter once the figures are in; trend is easier to argue about as a picture than as a row of numbers.
Ask questions about your data, generate formulas in plain English, and create charts instantly, all on top of the Sales Performance Dashboard.
Questions about this template
More finance templates
Personal Budget Tracker
Plan and actual side by side across twelve categories, with your savings rate worked out for you.
Use thisBusiness Expense Report
Receipts, mileage and approvals on one form, with separate billable and reimbursable totals.
Use this13-Week Cash Flow Forecast
Thirteen weeks of receipts and payments, with each week's closing balance rolling into the next.
Use thisSave hours
Skip the setup. Start from a ready-made structure.
Error-free
Pre-tested formulas that just work.
Professional
Designed for real-world use, ready to share.
Consistent
Maintain standards across every document.
Ready to use the Sales Performance Dashboard?
No setup, no learning curve, just results. Start free in seconds.
Pay as you go, no subscription required