Sales Pipeline & CRM Tracker
A forecast you can defend, because you set the win rates yourself.
About the sales pipeline & crm tracker
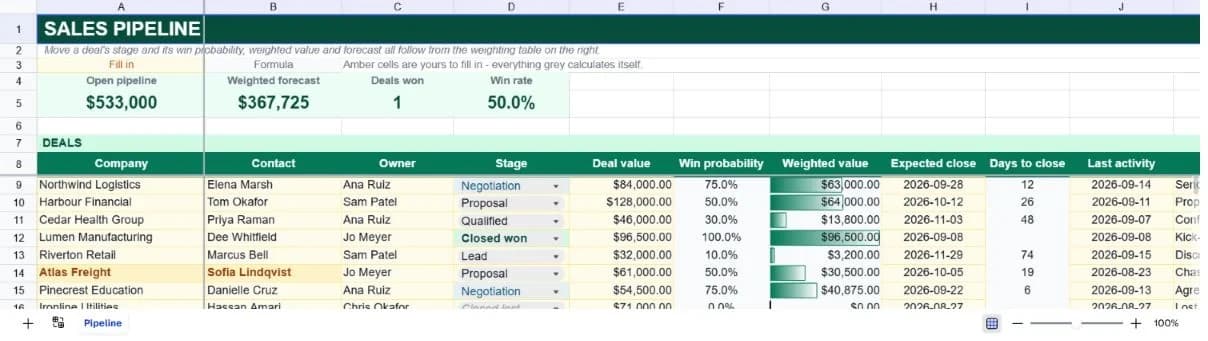
Most pipeline spreadsheets are a list of deals and a total at the bottom. That total is always wrong, because it assumes every deal closes. The fix is weighting: multiply each deal by the probability of its stage, and the sum becomes a number worth putting in front of somebody. This template does that, and it keeps the probabilities somewhere you can argue with them.
The stage weighting table sits at the top right of the sheet. Six stages run from Lead through to Closed won and Closed lost, each with a win probability you can edit. Every deal's probability is looked up from that table by its stage, so moving a deal from Proposal to Negotiation changes its weighted value without anyone touching a formula. Change a stage's percentage and the entire forecast re-weights at once.
The rest is the discipline a pipeline needs to stay honest. Days to close counts down against the expected close date and turns red once it has passed. Any open deal nobody has touched in three weeks highlights, because a pipeline quietly full of stale deals is the most common way a forecast turns out to be fiction. A by-stage roll-up underneath shows deal count, raw value and weighted value per stage, which is the shape of a pipeline review.
What’s in the template
Everything below is already built into the file. Open it and it’s there.
Editable stage weighting table
Six stages with default win probabilities, looked up by every deal on the sheet. Replace the defaults with your own close rates once you have enough history to know them.
Automatic weighted values
Each deal's probability comes from its stage via INDEX and MATCH, and the weighted value is deal value times that probability. Nothing is typed twice.
Stage dropdown
Stages are a closed list, because the stage string is what the lookup matches on. A typo would not just look untidy, it would empty that deal's weighted value.
Stale deal highlighting
Open deals with no activity in twenty-one days highlight amber. The rule ignores closed deals, so your won and lost history does not light up the sheet.
Days to close countdown
Counts down against the expected close date and turns red once it has passed, blanking itself for deals that have already closed either way.
By-stage roll-up
Deal count, total value and weighted value per stage, so you can see whether the pipeline is top-heavy with leads or genuinely progressing.
Who it’s for
Founders selling before they have a CRM
Twenty or thirty deals do not justify a seat-based CRM subscription. They do justify knowing what your weighted pipeline is worth, and this gets you that without an implementation project.
Sales managers running a weekly review
The by-stage roll-up and the stale-deal highlighting between them cover most of what a pipeline review is for: what is moving, what is stuck, and what the quarter actually looks like.
Consultants and agencies
A handful of large opportunities behaves very differently from a high-volume pipeline. Editable stage probabilities let you set weights that reflect your real close rates rather than a vendor's defaults.
Anyone reporting a forecast upward
Weighted forecast, win rate and open pipeline are the three numbers you will be asked for. They sit in the summary strip and recalculate from the deals below.
How to use the sales pipeline & crm tracker
- 1
Set your stage probabilities first
The defaults are reasonable starting points, but yours will differ. If eight in ten of your proposals close, Proposal should say 80%, not 50%, and your forecast will be far more useful for it.
- 2
Add deals with a value and an expected close date
Both matter. Value without a date gives you a pipeline with no timing; a date without a value gives you activity with no forecast.
- 3
Update the last activity date every time you touch a deal
This is the column that makes stale-deal highlighting work, and it is the one people forget. Thirty seconds per deal per week is the entire maintenance cost of this sheet.
- 4
Move stages rather than editing probabilities per deal
The point of the weighting table is that stage is the only thing you change. If one deal genuinely deserves a different probability, that is usually a sign you need another stage.
- 5
Review the roll-up weekly
A healthy pipeline has volume at the top and value at the bottom. If everything is sitting in Proposal, the problem is closing, not prospecting.
The formulas that ship with it
Every one of these is already in the file. They’re listed so you can see how it works, and change it if you want to.
Win probability (column F)
=IF($D9="","",IFERROR(INDEX($N$6:$N$11,MATCH($D9,$M$6:$M$11,0)),""))Looks the deal's stage up in the weighting table. INDEX and MATCH rather than a nested IF so that adding a stage means adding a row, not rewriting a formula.
Weighted value (column G)
=IF(OR($E9="",$F9=""),"",$E9*$F9)Deal value times stage probability. Blank until both are present, so a half-entered deal does not report as a zero-value opportunity.
Open pipeline (summary strip)
=SUMIFS($E$9:$E$48,$D$9:$D$48,"<>Closed won",$D$9:$D$48,"<>Closed lost")Total value of everything still in play. Both closed stages are excluded, so won deals do not inflate what is left to sell.
Win rate (summary strip)
=IF(COUNTIF(D9:D48,"Closed won")+COUNTIF(D9:D48,"Closed lost")=0,0,COUNTIF(D9:D48,"Closed won")/(COUNTIF(D9:D48,"Closed won")+COUNTIF(D9:D48,"Closed lost")))Won over decided, not won over everything. Deals still in play have not lost, and counting them as losses would understate the rate.
Tips for getting more out of it
- Set Closed won to 100% and Closed lost to 0% and leave them there. They are not probabilities any more, they are outcomes, and the weighting table only works if it reflects that.
- If your weighted forecast is consistently above what you actually close, your stage probabilities are too generous. Lower them by ten points and see whether the forecast starts matching reality.
- The stale threshold is three weeks. If your sales cycle is fast, that is too slow to be useful. The rule is ordinary conditional formatting and the number in it can be changed.
- Ask the assistant which deals are at risk, or what the forecast looks like if the Negotiation stage slips a month. It reads the sheet directly rather than needing the question rephrased as a formula.
Ask questions about your data, generate formulas in plain English, and create charts instantly, all on top of the Sales Pipeline & CRM Tracker.
Questions about this template
More business templates
Project Task Tracker
Owners, due dates and progress per task, plus a live count of what's overdue.
Use thisProfessional Invoice
Fifteen line items with per-line discounts. Subtotal, tax and balance due calculate themselves.
Use thisEmployee Directory & Org Chart
Contact details and reporting lines, with tenure and department headcount derived automatically.
Use thisSave hours
Skip the setup. Start from a ready-made structure.
Error-free
Pre-tested formulas that just work.
Professional
Designed for real-world use, ready to share.
Consistent
Maintain standards across every document.
Ready to use the Sales Pipeline & CRM Tracker?
No setup, no learning curve, just results. Start free in seconds.
Pay as you go, no subscription required