Somebody sends you a spreadsheet and asks what it says. You could build pivot tables for an afternoon, or you could ask.
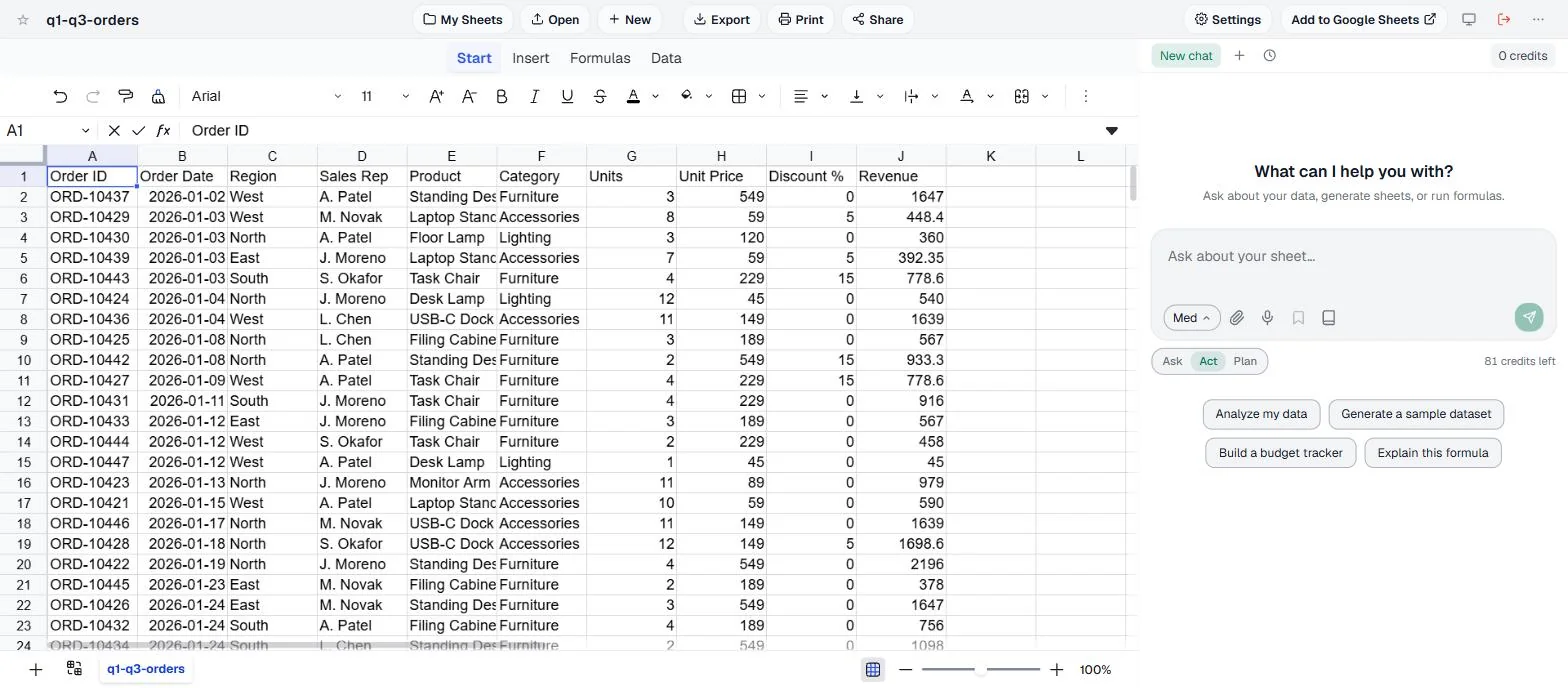
This is a walkthrough of the second option, done for real. We took a 262-row sales export, one row per order, January to August, dropped it into SheetAI, and asked it what a sensible analyst would ask. Every screenshot below is from that session. Wherever a step is different in Excel, Google Sheets or CSV, we say so.
Step 1: Get the file in front of the AI
This is the only step that depends on what kind of file you have, and it's shorter than you'd think.
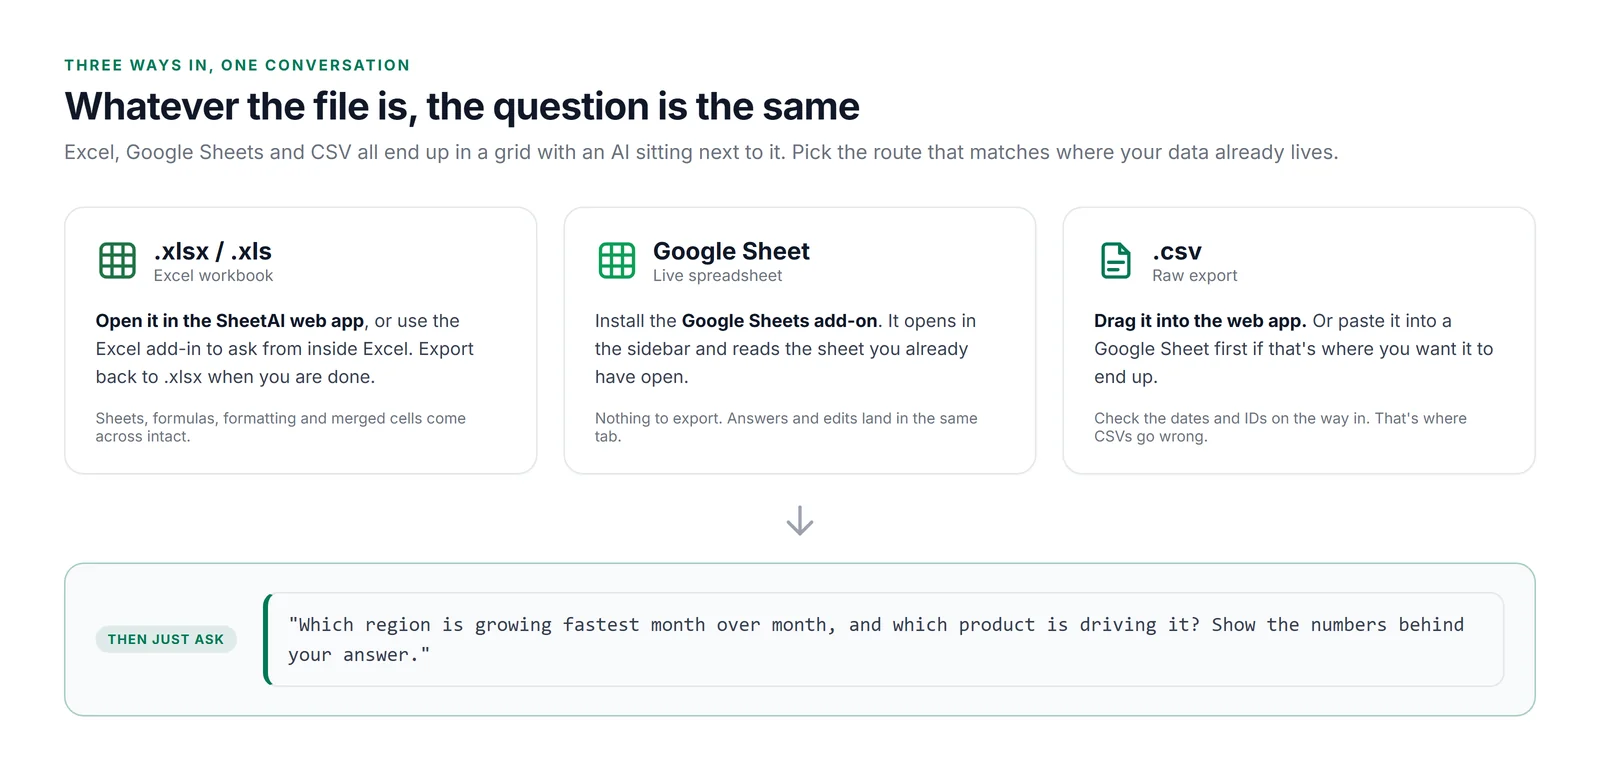
Excel (.xlsx, .xls, .xlsm)
Open the web app, click Open, pick the file. Sheets, formulas, formatting and merged cells come across as they are. When you're done, Export gives you an .xlsx back. Prefer to stay in Excel? The SheetAI Excel add-in puts the same chat in a task pane inside Excel on the web, Windows or Mac.
Google Sheets
Install the SheetAI add-on from the Workspace Marketplace, then Extensions → SheetAI → Open. It sits in the sidebar and reads whatever tab you have open. Nothing to export, nothing to re-import.
CSV
Same Open button in the web app. CSV is the format most likely to bring problems with it - dates that arrive as text, leading zeros stripped from IDs - so this is the file type where the next step matters most.
Step 2: Profile it before you ask it anything
The temptation is to go straight to the interesting question. Don't. The most common way an AI analysis goes wrong isn't the maths - it's that nobody checked what the data was before doing maths on it. Partial months invent declines. Text-typed dates make date filters silently return nothing. Duplicated rows double a total.
So the first prompt is deliberately boring. Switch to Ask mode, which reads and answers without touching a cell, and paste this:
Profile this sheet before I analyse it. What does one row represent, what date range does it cover, is the last month complete, and is anything blank, duplicated or stored as the wrong type? Keep it short.
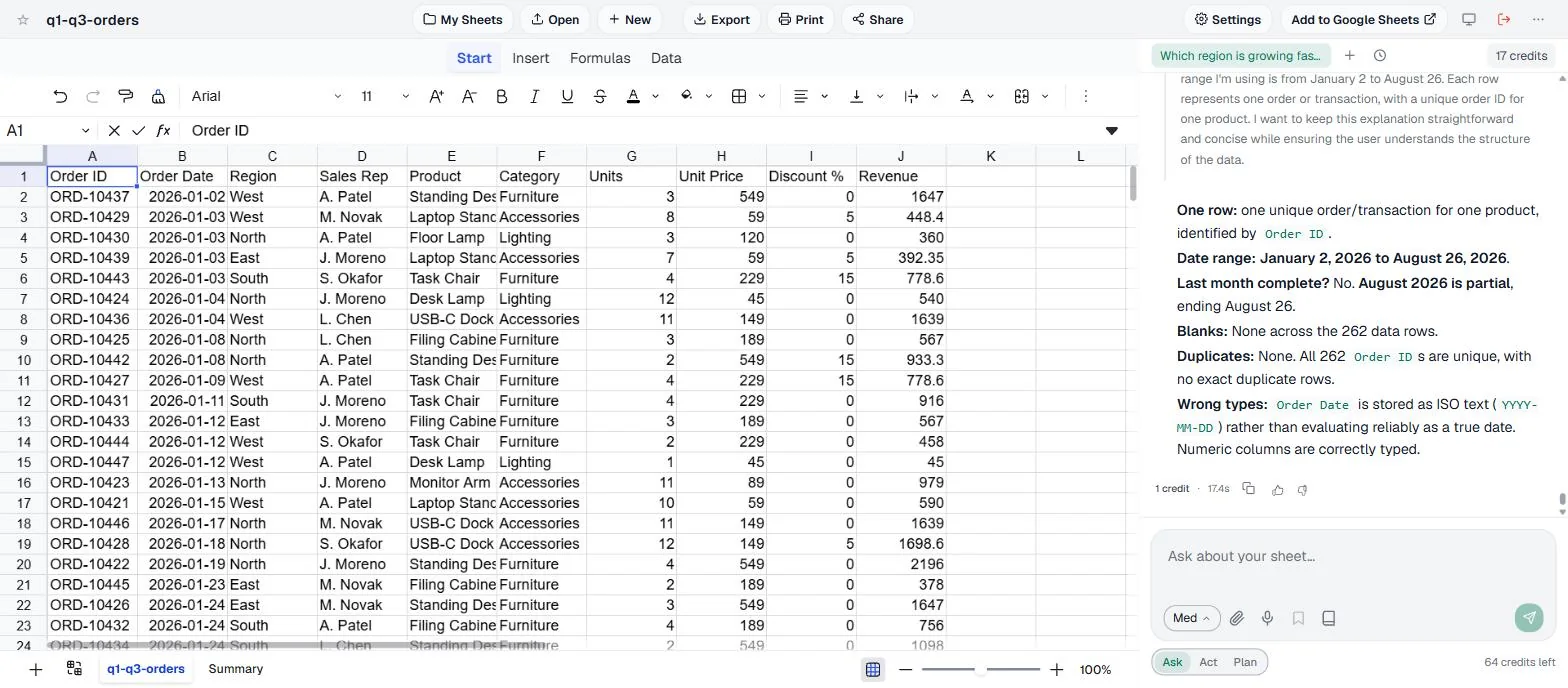
Look at what it found. August is partial - so any "August is down" finding would have been an artefact of the export date, not the business. And the date column is text, which is normal for a CSV and invisible to the eye, but it means any formula that compares dates will quietly compare strings instead. Fix it before you build anything on top.
Step 3: Ask in the right order
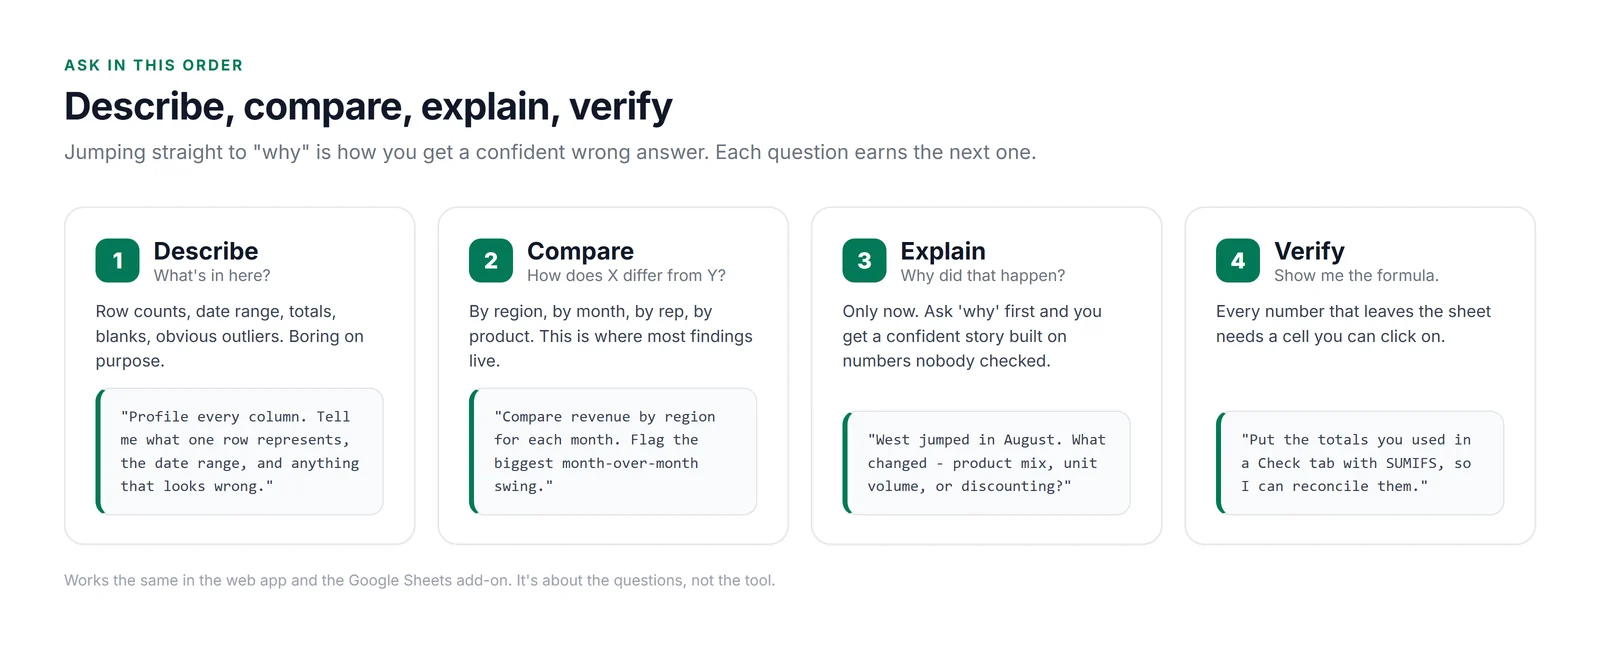
There's a sequence to good analysis questions, and it's the same whether a person or a model is answering them. Describe what's there. Compare it across the dimensions you care about. Only then ask why. And before any number leaves the sheet, ask to see the working.
Here's the compare-and-explain question we asked, still in Ask mode:
Which region is growing fastest month over month, and which product is driving it? Show the numbers behind your answer.
That last sentence isn't decoration. Without it you get a paragraph. With it you get a table you can check.
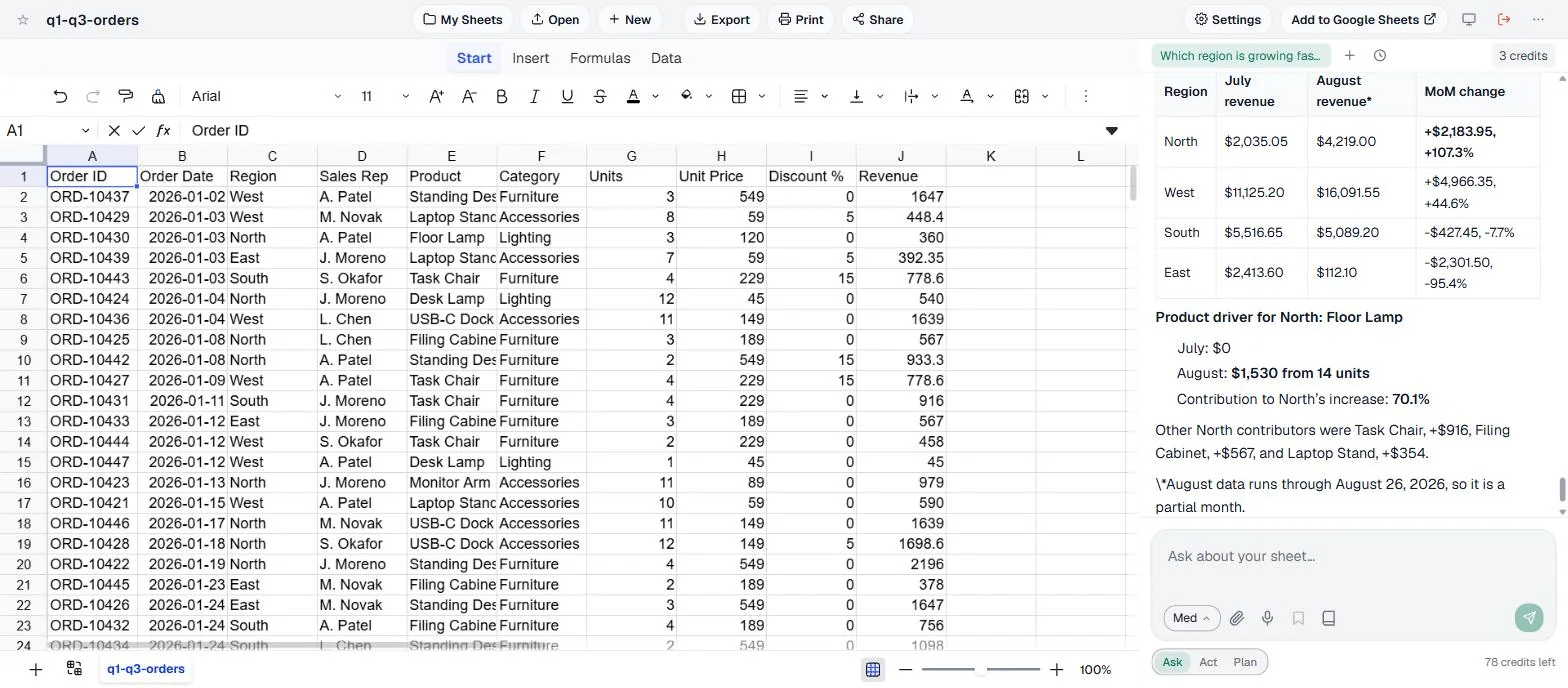
Two things worth noticing. First, "fastest growing" is ambiguous - percentage or dollars? - and instead of picking one silently it showed both and said which it used. Second, it didn't just name a product; it said Floor Lamp explains 70.1% of North's increase and listed the next three contributors. That's the difference between an answer and a claim.
It reasons out loud, too. Above every answer there's a collapsible Thinking section where you can watch it decide between percentage and dollar growth, notice the partial month, and check its totals. You don't have to read it. But when an answer surprises you, it's the first place to look.
How to write the prompt
Most bad AI analysis comes from a prompt that says "analyse this" and nothing else. The model can count rows; it can't know what they mean, what you're deciding, or what shape of answer you'll actually use. Give it four things.
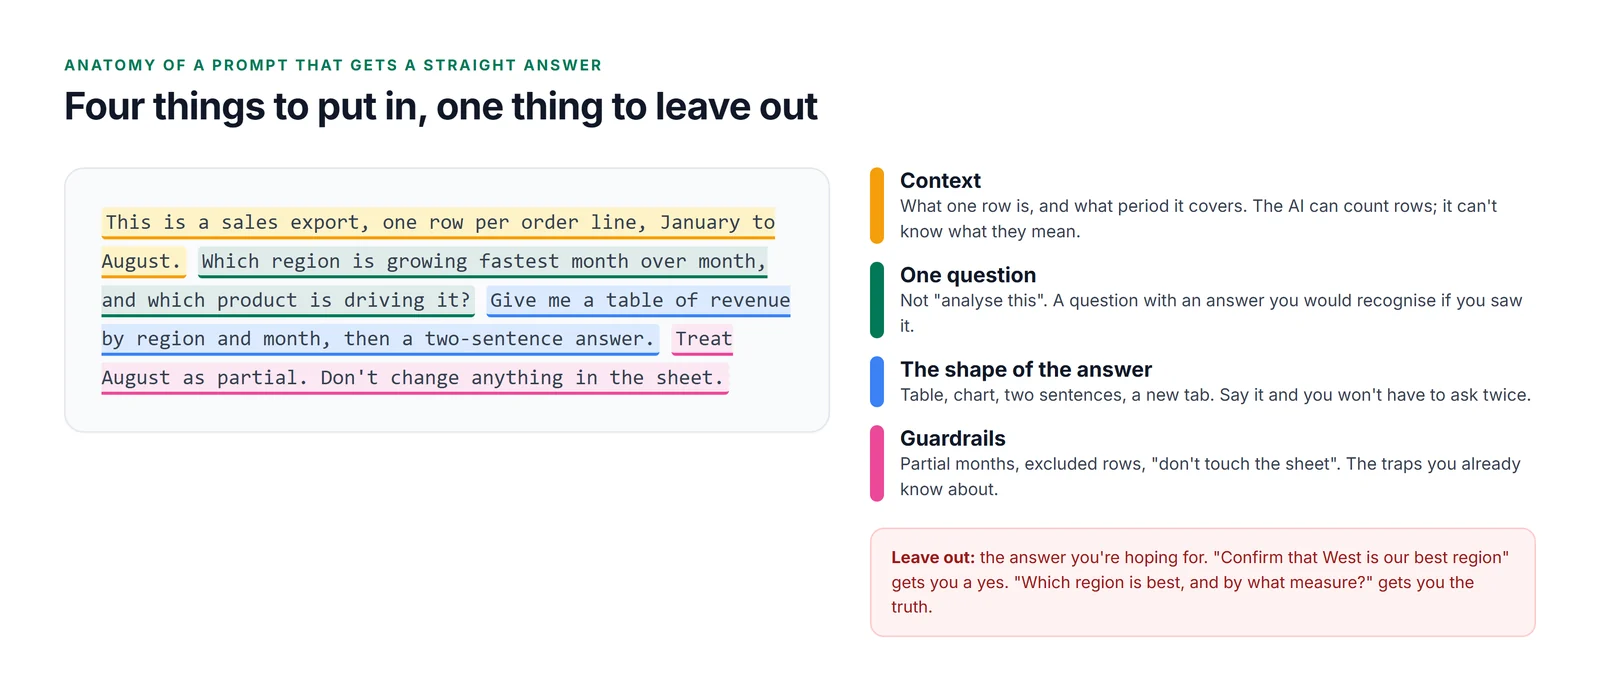
- Context. What one row is, and what period the data covers. Ten words that stop it counting order lines as orders.
- One question. Not "insights". A question with an answer you'd recognise if you saw it.
- The shape of the answer. A table, a chart, two sentences, a new tab. Say it and you won't have to ask twice.
- Guardrails. Partial months, rows to exclude, "don't change the sheet". Everything you'd tell a new analyst on their first day.
Step 4: Build the output - and check it
Once you know what the answer is, you usually want it in the sheet: a summary tab, a chart, something you can send. That's Act mode. Same chat, but now it writes.
We asked for a Summary tab: revenue per region for each month, a total column, currency formatting, and a line chart of monthly revenue per region to the right of the table. And one more sentence at the end: confirm the summary total matches the orders sheet.
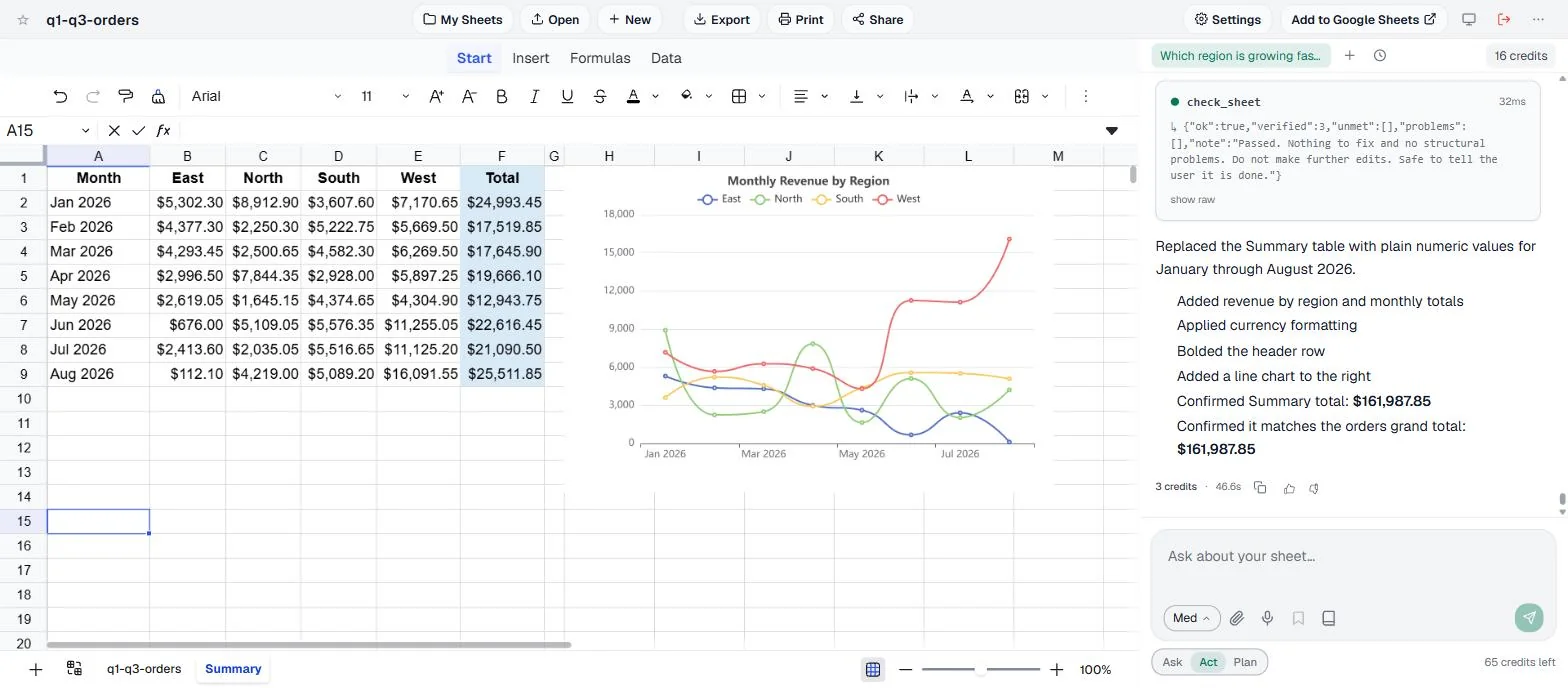
West's climb from June is the first thing you see, which is exactly the finding from Step 3, now in a form you can send. Every Act-mode change lands with an Accept / Reject bar, so if you'd like it laid out differently, one click puts it all back.
Ask, Plan or Act?
The three modes are the same in the web app and the Google Sheets add-on, and the choice is simpler than it looks.
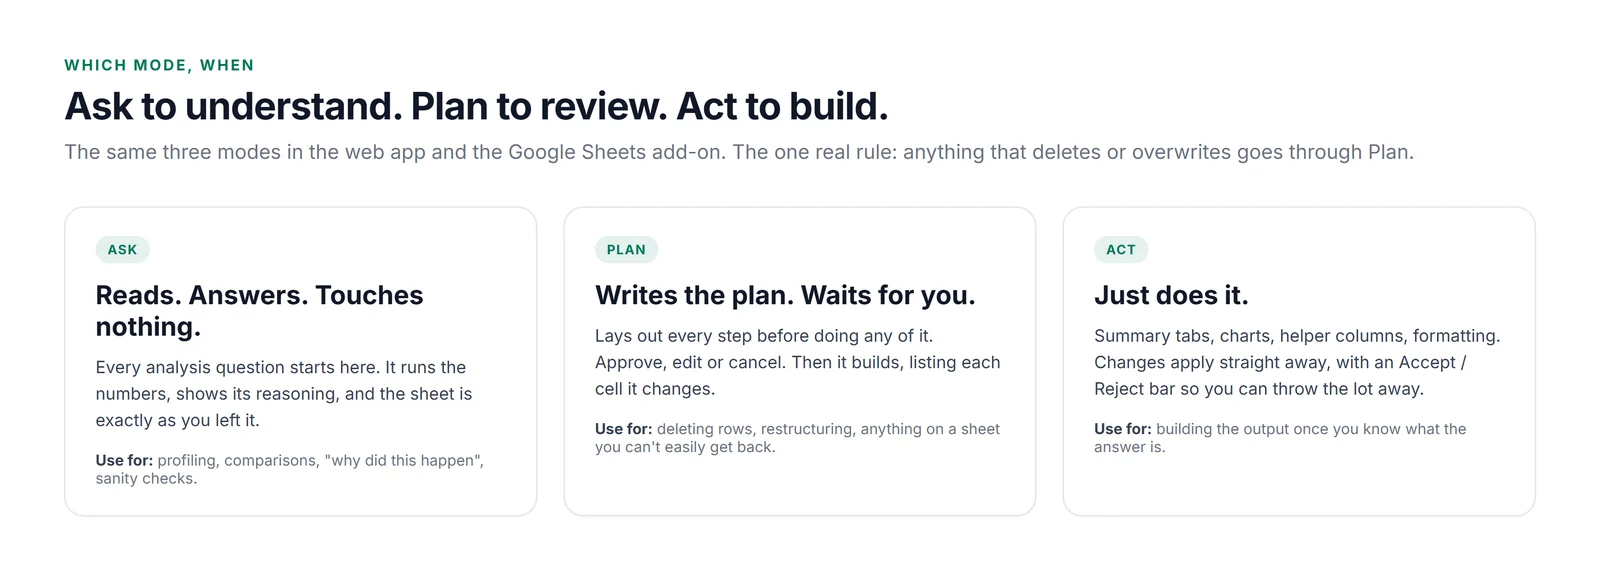
Analysis questions - all of Steps 2 and 3 above - belong in Ask. Nothing moves, so you can be as exploratory as you like. Building the summary tab is Act. And if the request involves deleting rows, restructuring, or anything on a sheet you can't easily get back, use Plan: it writes out every step first and waits for you to approve.
Where each file type is different
Google Sheets
Everything above works the same, but you never leave the tab. The add-on reads the sheet you have open, answers in the sidebar, and writes into the same grid. It also logs every read and write as it goes - "read cells E1:G14", "updated G3" - so you can audit what it touched.
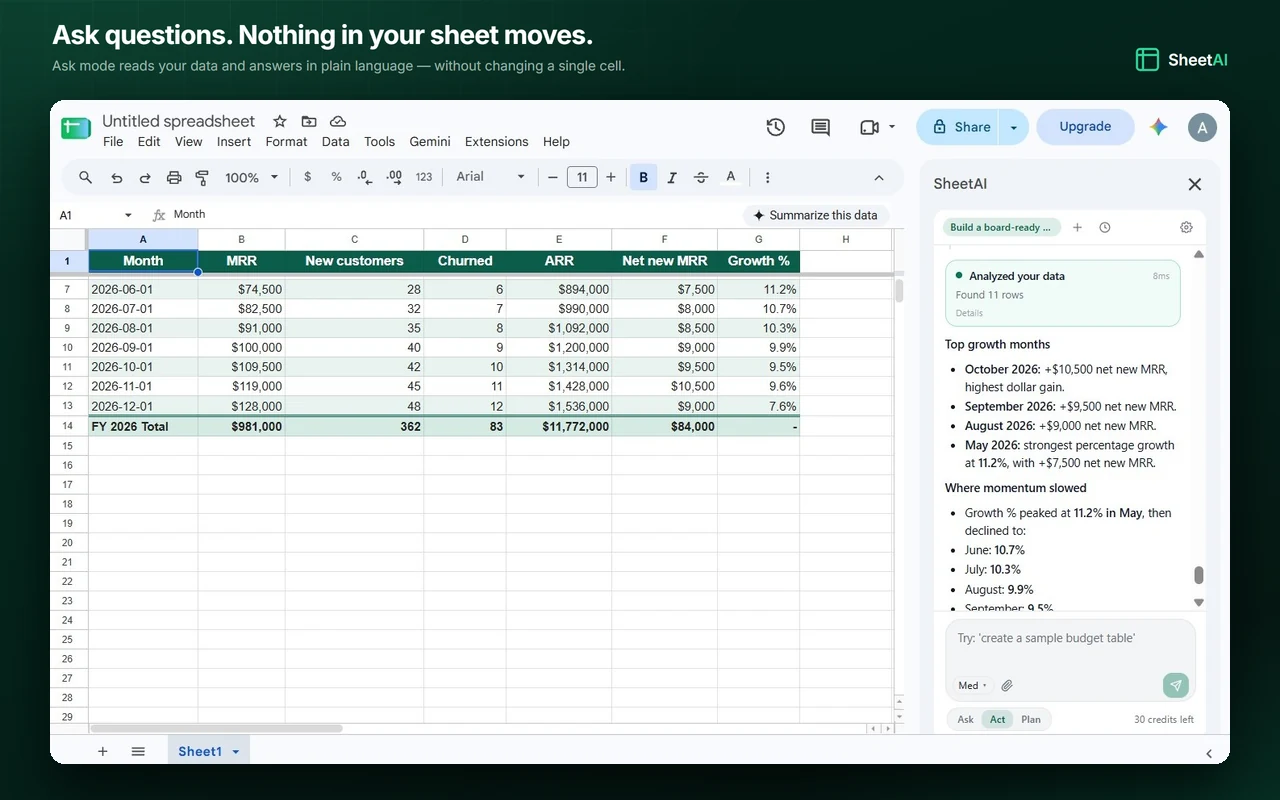
One Sheets-specific tip: if your data is a live import (a form, a connected source), say so in the prompt. "This sheet updates daily" changes the advice from "paste values" to "write formulas that keep working".
Excel
Excel files carry the most baggage: multiple sheets, formulas that reference each other, merged headers, hidden columns. All of that survives the upload, and it's worth telling the AI which sheet is the source of truth if there's more than one ("analyse the Data tab, ignore the Dashboard tab, it's derived"). When you're done, export to .xlsx and the summary tab and chart come with it. If the workbook is already full of formulas, ask it to explain them before it changes them.
CSV
CSV has no types, so everything arrives as text and the import guesses. Dates are the usual casualty, and so are IDs with leading zeros and anything that looks like a number but isn't. The profile prompt in Step 2 catches all three. If it flags a problem, fix the column first - it's one more prompt, and every formula downstream depends on it.
Prompts you can paste
The ones we use most, in the order we use them. Swap the column names for yours.
| When | Mode | Prompt |
|---|---|---|
| First | Ask | Profile this sheet. What is one row, what date range, is the last month complete, is anything blank, duplicated or the wrong type? |
| Describe | Ask | Give me totals and averages for every numeric column, and the top and bottom five rows by Revenue. |
| Compare | Ask | Compare Revenue by Region for each month. Flag the biggest month-over-month swing and say whether it's percentage or dollars. |
| Explain | Ask | West jumped in June. What changed - product mix, unit volume, or discounting? Show the numbers. |
| Sanity check | Ask | What in this data would you not trust, and why? |
| Build | Act | Add a Summary tab: revenue by region and month, total column, currency format, line chart beside it. Confirm the totals match column J. |
| Write-up | Ask | Write a five-bullet summary for someone who hasn't seen the data, with a caveat about the partial month. |
Where you come in
Some context lives outside the file: whether refunds are in the export, that the East region was reorganised in May, or that Revenue is net of discount in one system and gross in another. Tell the AI in a sentence and it builds that into every answer. Two minutes with whoever sent the file is the best investment in any analysis.
What it will do is the part that used to take the afternoon: the profiling nobody does thoroughly by hand, the comparisons across every dimension, the summary tab with the chart, and - if you ask - the reconciliation that proves the summary matches the source. That leaves you with the part that needs a human: deciding what the numbers mean, and what to do about them.
Try it on your own export
Open a file, paste the profile prompt from Step 2, and see what it finds before you analyse anything.
Open SheetAI