Google Sheets is where a lot of real data actually lives: form responses, shared trackers, exports someone pasted in on Monday. So "use AI in Google Sheets" usually means one of two things. You want to ask questions about what's in the sheet, or you want the sheet to do something with text that formulas can't handle, like sort comments into themes.
This is a walkthrough of both, done for real with the SheetAI add-on for Google Sheets. We used a month of answers from a customer survey built in Google Forms: 48 responses, each with a plan, a score out of 5, a yes/no/maybe on renewing, and one free-text question, "What's one thing we could do better?". Every screenshot below is from that session.
Install it and open the sidebar
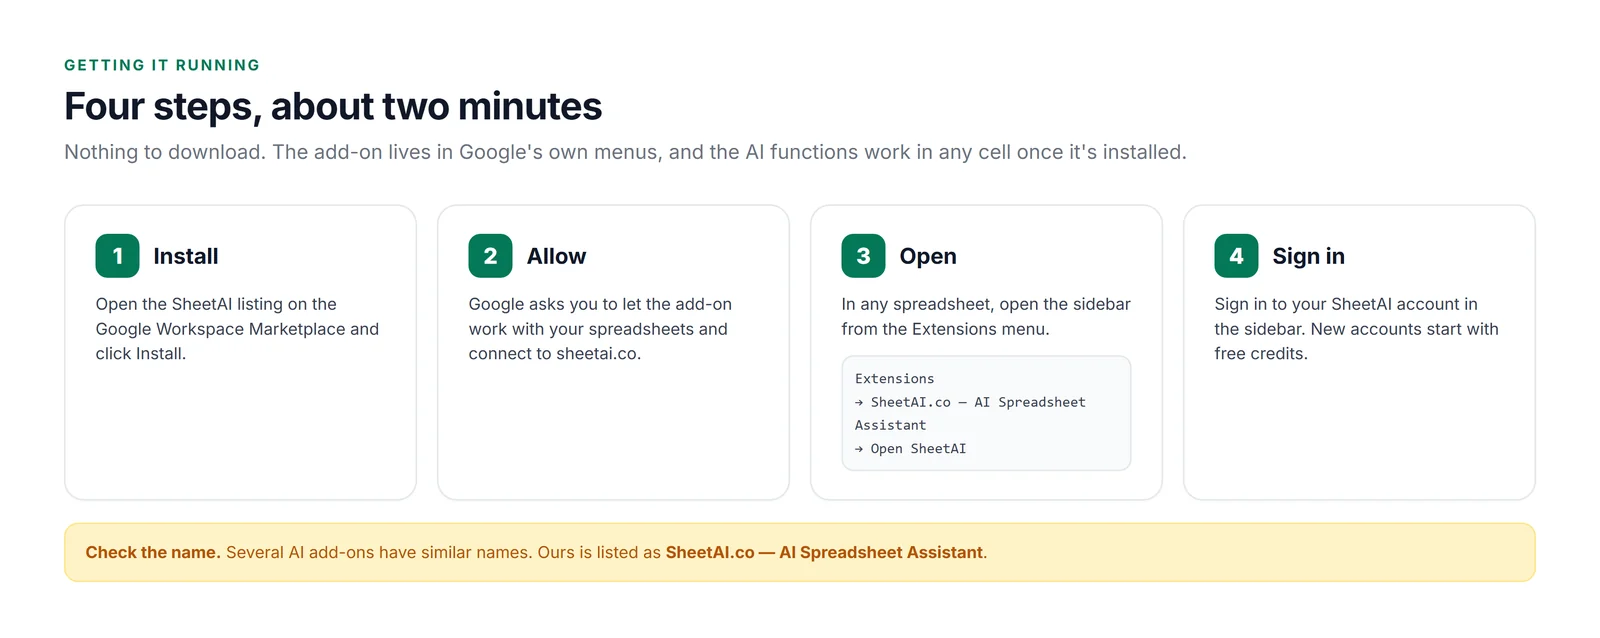
One practical note, because we tripped over it ourselves: there are several AI add-ons with similar names in the Extensions menu if you've tried a few. Ours is SheetAI.co — AI Spreadsheet Assistant. The sidebar opens on the right of the sheet and stays there while you work.
Step 1: Ask a question (Ask mode)
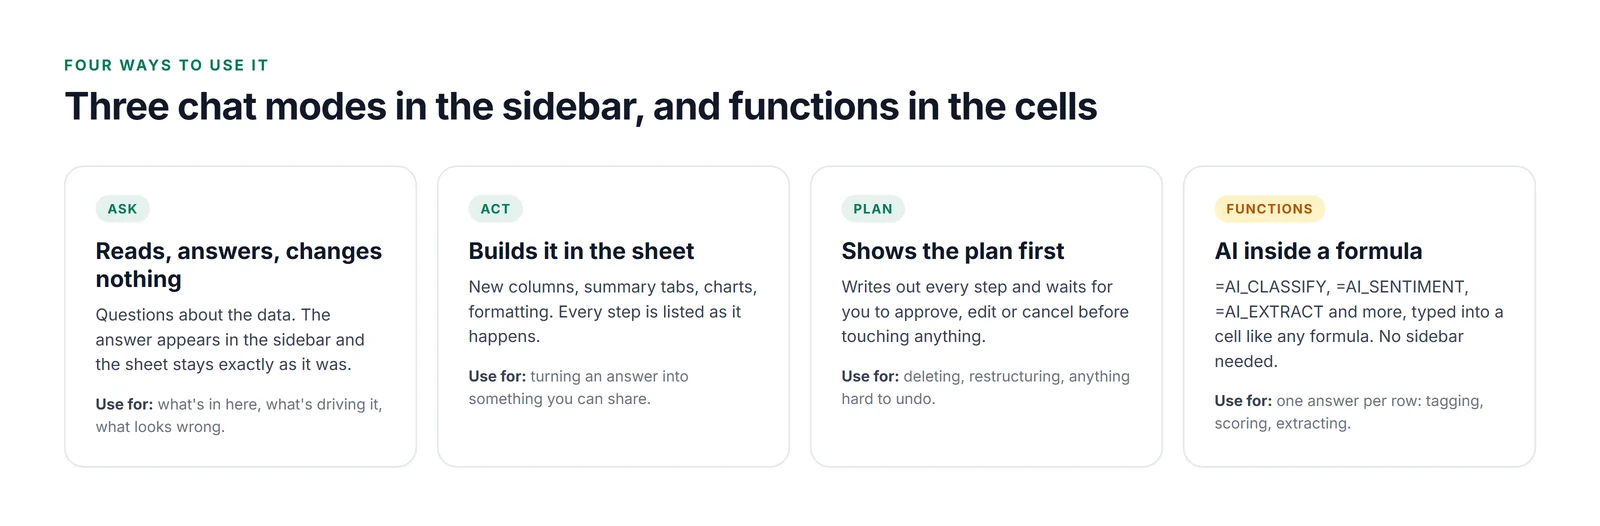
Survey free text is the classic job nobody wants. Forty-eight comments is too many to hold in your head and too few to justify building anything. So we switched the sidebar to Ask mode, which reads and answers without changing the sheet, and asked the question a product manager would actually ask:
These are the September responses from our customer survey form. What are people unhappiest about? Group the comments into themes, count how many mention each, and tell me which themes come with the lowest scores and the most 'No' answers to renewing.
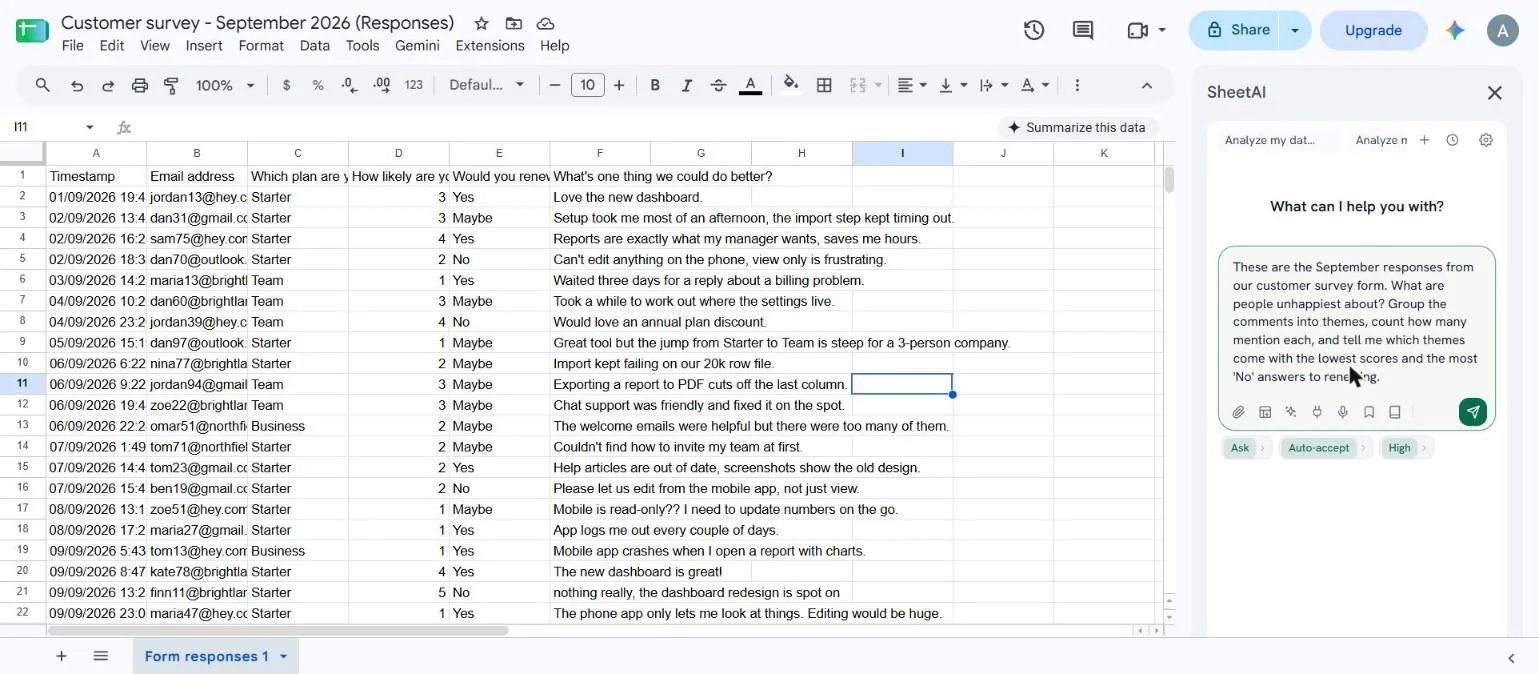
It took 47 seconds and 4 credits, and came back with the shape of the whole month: 37 of the 48 responses named a problem, 10 were positive or had no clear issue, and 1 asked for a new feature. Then a table, one row per theme, with mentions, average score and the number of "No" renewals.
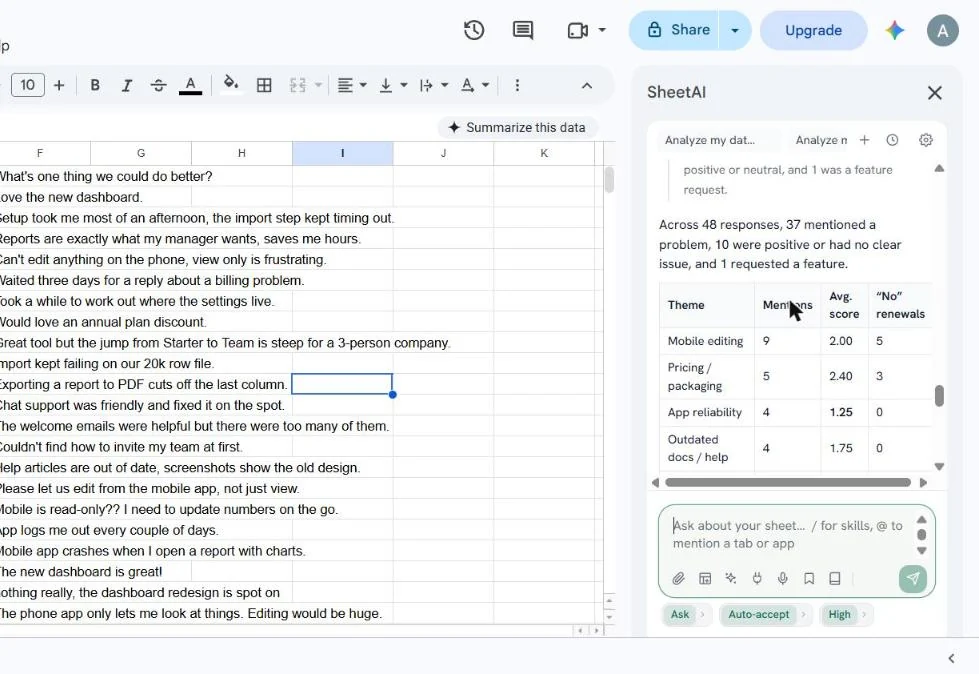
We checked every row of that table against the responses by hand. All of it was right: 9 people asking to edit from their phone, averaging 2.00 out of 5, five of them saying they wouldn't renew. Pricing came second with 5 mentions and 3 "No" answers. App crashes and log-outs had the lowest scores of all (1.25), but nobody in that group said they'd leave.
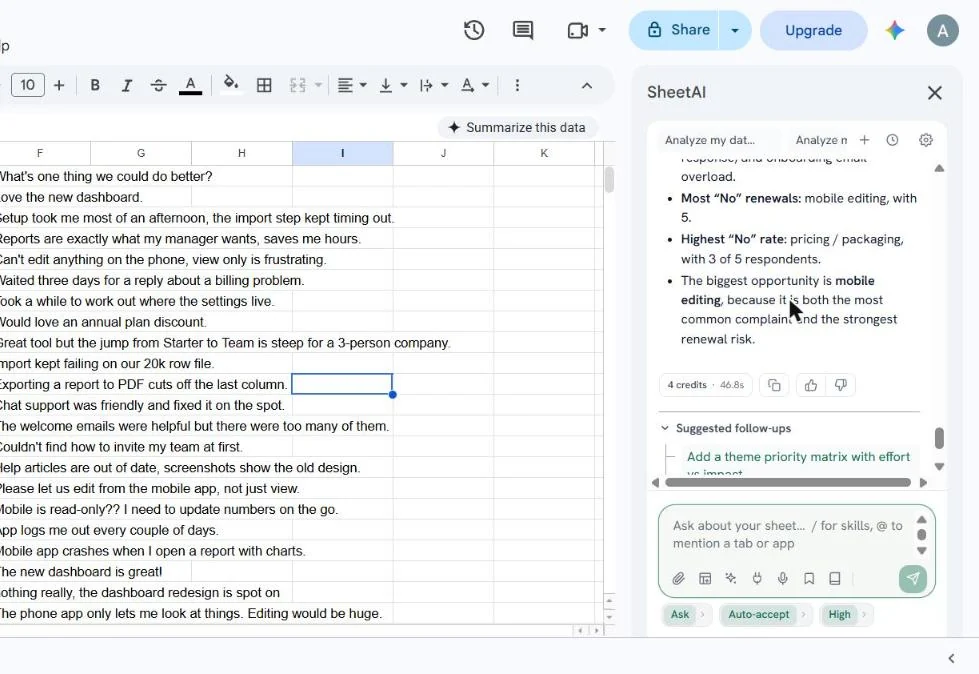
The findings are what make this useful, because they don't collapse into one ranking. The angriest people (app reliability) aren't the ones about to leave. The ones about to leave are asking for mobile editing and complaining about the price jump between plans.
Four ways to use it
Step 2: Build it into the sheet (Act mode)
An answer in a sidebar is fine for you. The rest of the team will want it in the sheet, and next month's responses will need the same treatment. So we switched to Act mode and asked for something that would keep working:
Good. Now put it in the sheet: add a Theme column after the comments using those themes, then a new Summary tab with one row per theme (mentions, average score, number of No renewals), sorted by mentions, and a bar chart of mentions by theme. Use formulas that point back at the responses so it updates when new answers come in.
This took about three minutes and 9 credits.
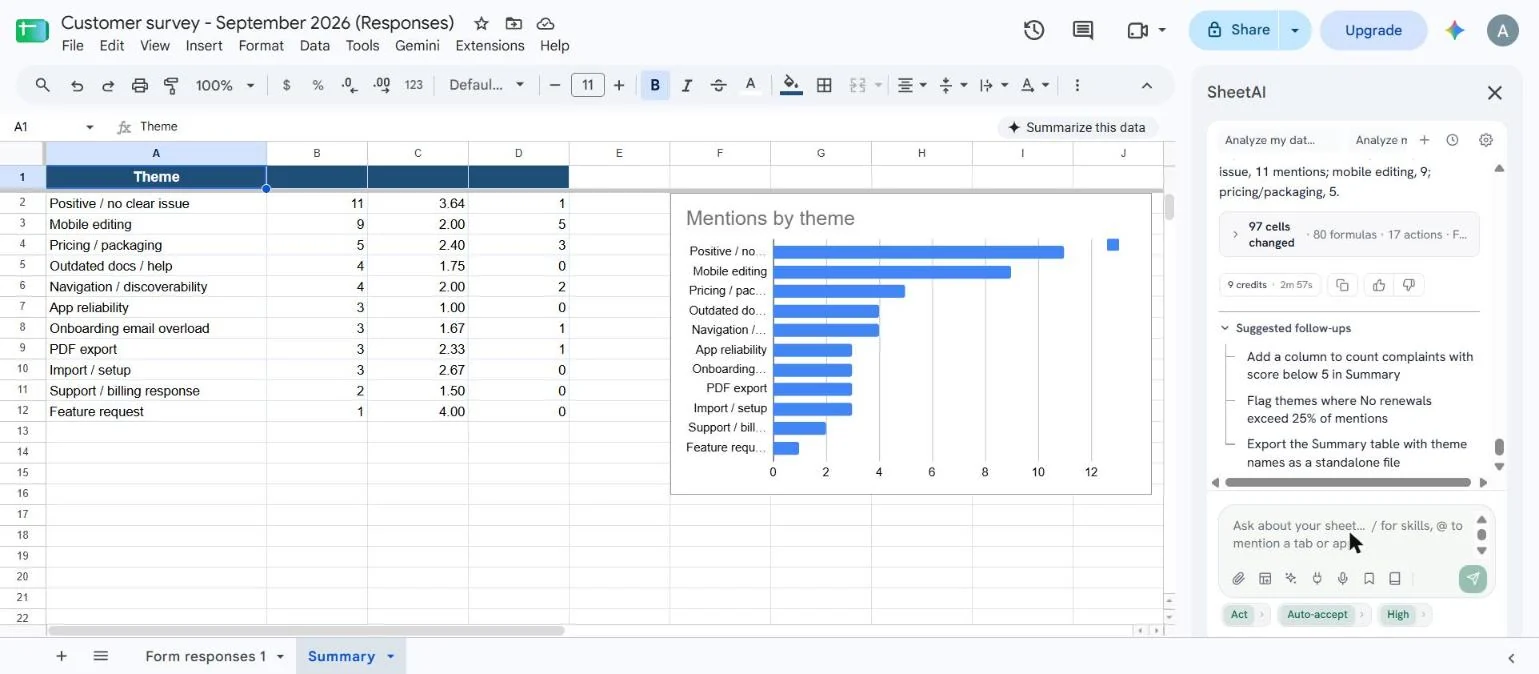
It's a proper result: a native Google Sheets chart, 80 formulas, and a Theme column that fills itself for every new response. If you'd rather the chart showed complaints only, one more sentence does it: "leave the positive responses out of the chart".
How the Theme column works
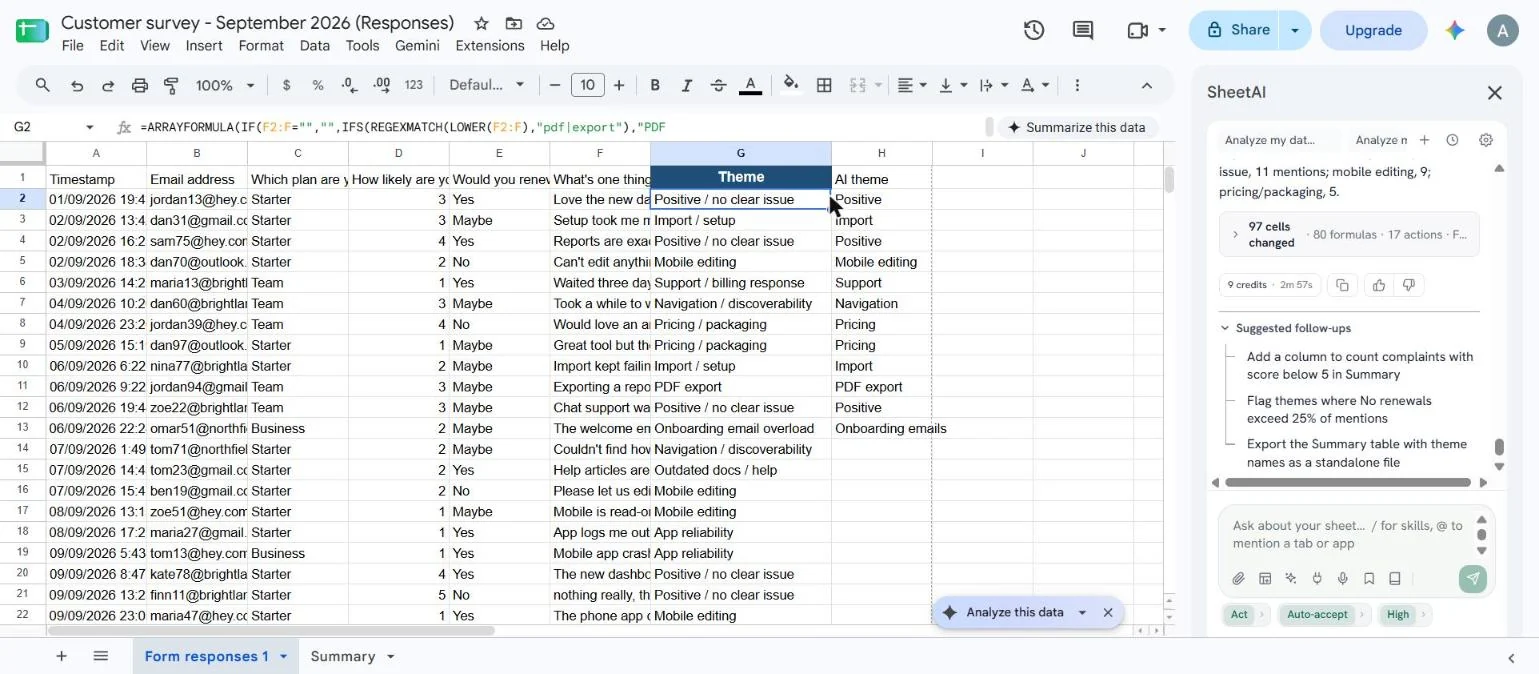
To make the Theme column update itself, the AI wrote a single formula for the whole column that tags each comment by its keywords: "pdf" or "export" means PDF export, and so on. It's free, it's instant, and it covers every future row, so next month's responses are tagged the moment the form adds them.
Step 3: AI functions in the cells
For comments where the meaning matters more than the keywords, the add-on has AI functions. =AI_CLASSIFY reads each comment with your list of categories and returns the one that fits. We added an "AI theme" column and typed this into H2:
=AI_CLASSIFY(F2, "Mobile editing, Pricing, App reliability, Outdated docs, Navigation, Onboarding emails, PDF export, Import, Support, Feature request, Positive")We copied it down the first twelve rows. It matched the keyword themes on every one, and because it reads the sentence rather than searching it for words, it handles wording nobody would think to write a rule for.
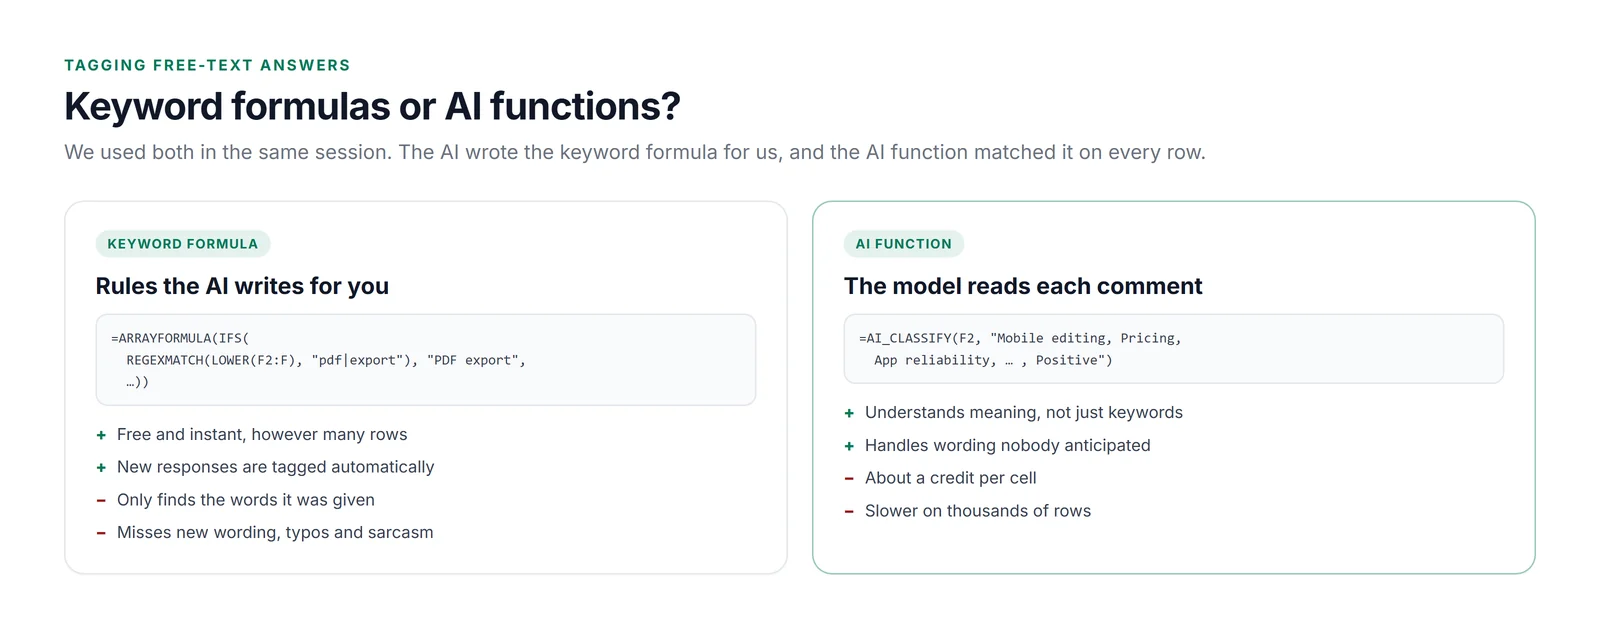
The trade-off is cost. Each AI function cell is a call to the model, at least one credit each, so a 48-row column is roughly 48 credits where the keyword formula costs nothing. Repeat calls with exactly the same input are usually served from a cache for free. For a monthly survey of this size that's fine. For 20,000 product reviews, a keyword formula for the bulk and AI functions for the free-form comments is a good mix.
When to use Plan mode
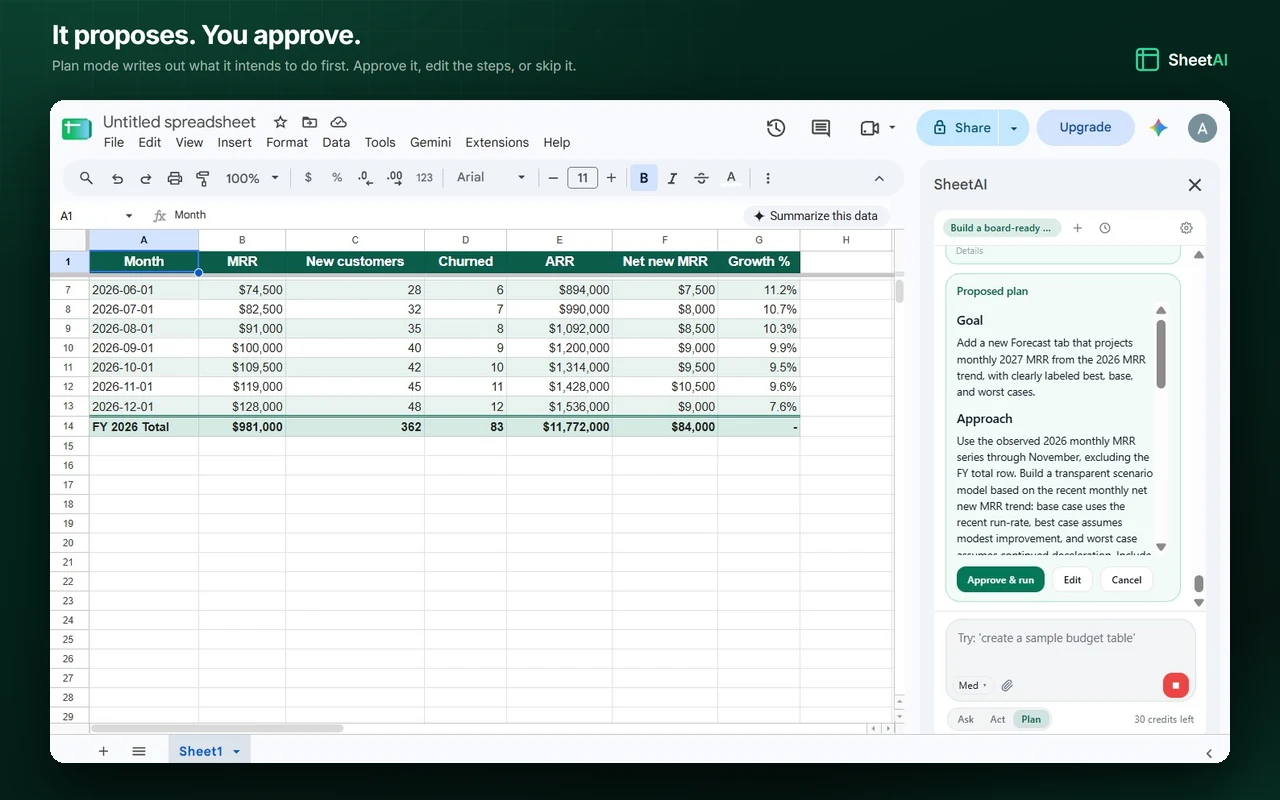
We didn't need Plan mode for this survey, because nothing we asked for was destructive. But if we'd asked it to delete test responses or restructure the form tab, Plan is the one to use. It writes every step out first and waits for you to approve, edit or cancel before anything changes.
Prompts you can paste
| When | Mode | Prompt |
|---|---|---|
| Form responses | Ask | Group the comments in column [F] into themes, count each, and show the average score and number of 'No' answers per theme. |
| Build it | Act | Add a Theme column and a Summary tab with mentions, average score and No count per theme, sorted, with a bar chart. Use formulas so it updates. |
| Chart | Act | Leave the positive responses out of the chart and retitle it to say what it shows. |
| Tag by meaning | Functions | =AI_CLASSIFY(F2, "theme 1, theme 2, theme 3") |
What we'd tell someone trying it tomorrow
Start in Ask mode and ask a real question. The answer we got was right on every number and better organised than what we'd have produced in an hour with a pivot table and some patience. Then build it with Act, and you have a summary tab and chart that keep themselves up to date as responses arrive.
And when the wording is free-form, which with survey comments it usually is, that's what the AI functions are for. They read the sentence, not just the keywords, right inside the cell.
Try it on your own form responses
Install the add-on, open the sidebar on your responses tab, and ask what people are unhappiest about.
Get the Google Sheets add-on